
Overview
The company dashboard provides you a detailed overview of your company. If you leave this page open, it will continue to automatically load new data in realtime throughout the day.
This guide goes into detail on each dashboard widget and how the numbers are generated.
Today’s Jobs
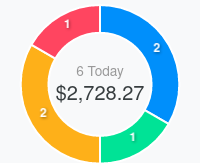
The Today Summary pie chart displays a summary of the day’s jobs.
The jobs are divided into categories based on their Job status. Each segment of the ring is a different job status.
The revenue total reflects the total amount charged on all counted jobs. Unlike elsewhere on the dashboard, this widget counts revenue for uncompleted jobs.
Jobs statuses included are: SCHEDULED, INROUTE, CHECKEDIN, DELAYED, INPROGRESS, QC, CURING, PICKUP, LATEPICKUP, PICKEDUP, COMPLETE
Future Jobs
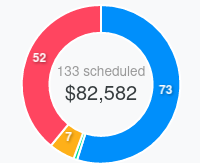
The Future Jobs pie chart displays a summary of jobs with a pickup date in the future.
The jobs are divided into categories based on their vehicle type. Each segment of the ring counts different vehicle types.
The revenue total reflects the total amount charged on all counted jobs. Unlike elsewhere on the dashboard, this widget counts revenue for uncompleted jobs.
Job status included are: SCHEDULED, INROUTE, CHECKEDIN, DELAYED, INPROGRESS, QC, CURING, PICKUP, LATEPICKUP, PICKEDUP, COMPLETE
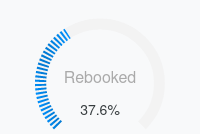
30 Day Rebooked Rate
The Rebooked Rate Counter displays the percentage of jobs created in the past 30 days whose customer has a previously occurring job in the books marked as COMPLETE.
Job status included are: SCHEDULED, INROUTE, CHECKEDIN, DELAYED, INPROGRESS, QC, CURING, PICKUP, LATEPICKUP, PICKEDUP, COMPLETE
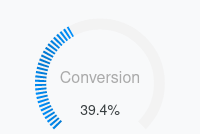
30 Day Conversion Rate
The Conversion Rate Counter displays the percentage of all jobs and estimates created in the past 30 days that are in a converted job status.
Job status counted as converted are: SCHEDULED, INROUTE, CHECKEDIN, DELAYED, INPROGRESS, QC, CURING, PICKUP, LATEPICKUP, PICKEDUP, COMPLETE
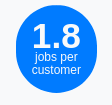
Jobs Per Customer
The Jobs Per Customer counter displays the average number of jobs per customer. The Anonymous Estimate customer, or any customers with 0 jobs do not count towards this average.
Jobs counted for customer average are in the job status SCHEDULED, INROUTE, CHECKEDIN, DELAYED, INPROGRESS, QC, CURING, PICKUP, LATEPICKUP, PICKEDUP, COMPLETE
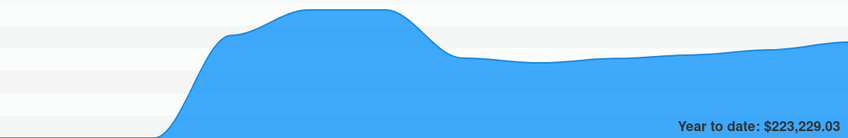
Monthly Revenue Graph
The Monthly Revenue Graph displays the revenue summary by month of all COMPLETE jobs whose pickup date falls within the monthly time period.
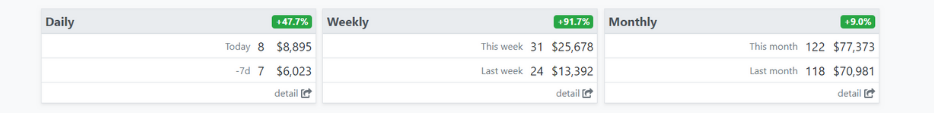
Daily, Weekly, and Monthly Revenue Summary
The Revenue Summary tables total the number of jobs and amount charged on invoices for all invoices in COMPLETED status whose pickup date is set within the stated time period.
Recent Inspection Photos
The three most recently saved inspection photos are displayed on your dashboard.
Clicking on any of these photos views the job invoice where the photo was taken.

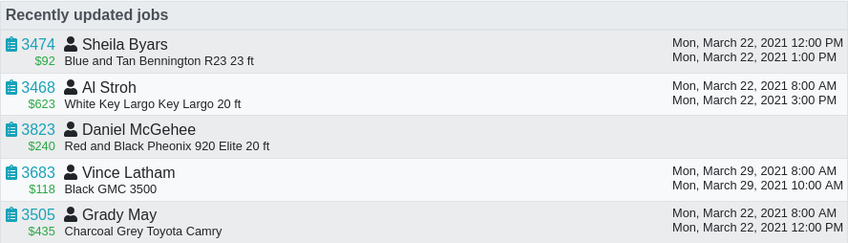
Recently Updated Jobs
The Recently Updated Jobs table displays the last five jobs or estimates that have been updated or created.
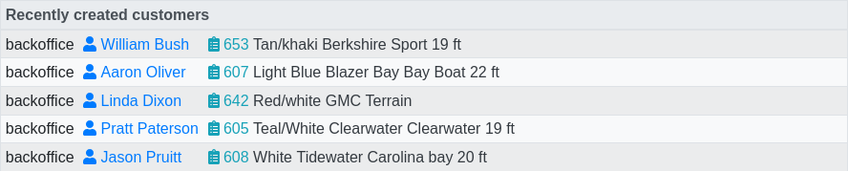
Recently Created Customers
The Recently Created Customers table displays the last five customers that were created, and their most recent job or estimate details.
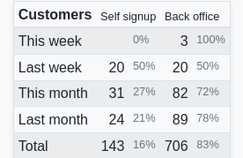
Customer Sign Up Summary
The Customer Sign Up Summary table displays the number of new customers created within various time periods, and if they were self-signups on your Booking website, or if they were added by your staff in your Backoffice website
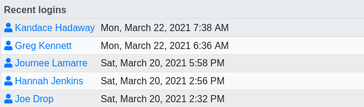
Recent Logins
The Recent Logins table displays the five most recent staff logins to your Backoffice website.
Individual persons will only appear one time in this table.